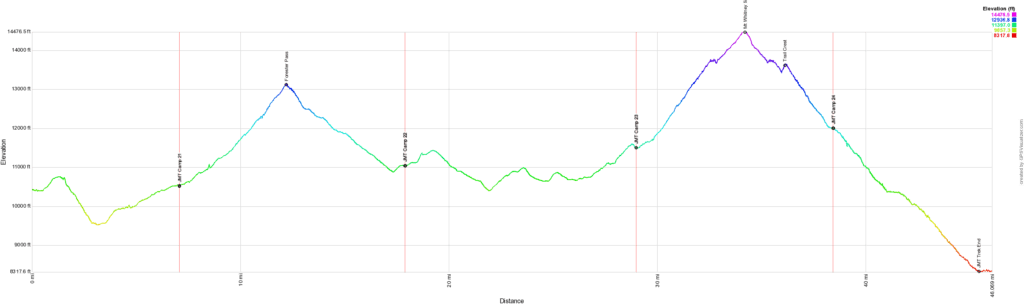
I went over my GPS tracks and came up with some elevation profiles and data on elevation climbed and descended during the four legs of my JMT August 2020 trek. Data is approximate based on my own GPS tracks, some fixes I had to do to make up for lost data/forgotten recording of tracks, and elevation looked up when creating the profile.
The distance and elevation climbed stats blow away the same stats from my Mt Meru and Kilimanjaro climbs, even when those two mountains are added together. And the time is over twice as long (3.5 days for Mt Meru and 8 days for Kilimanjaro).
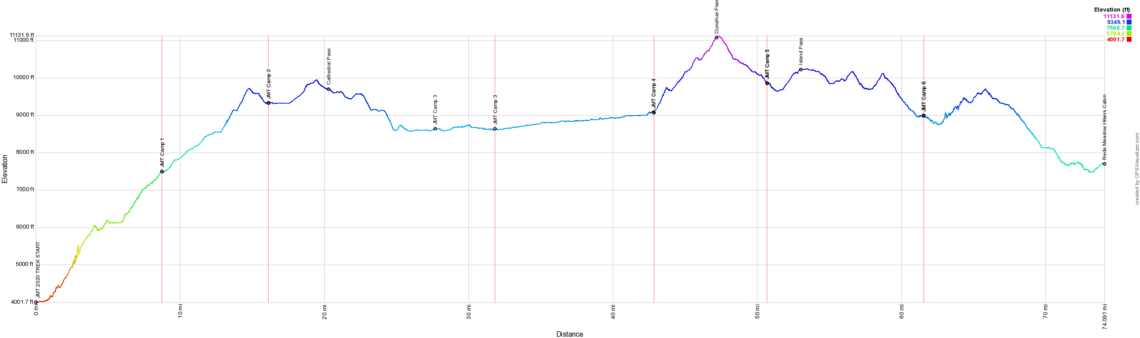
LEG 1 – Yosemite Happy Isles to Reds Meadow
(approximate mileage, elevation data, and times)
TRACK STATISTICS
JMT Day 1
distance: 8.756 mi
time: 8:16:57
min/max elev.: 4002’/7501′
elev. gain/loss: 4529’/-1032′
JMT Day 2
distance: 7.380 mi
time: 6:57:05
min/max elev.: 7458’/9717′
elev. gain/loss: 2265’/-434′
JMT Day 3
distance: 15.72 mi
time: 10:46:43
min/max elev.: 8572’/9944′
elev. gain/loss: 1147’/-1855′
JMT Day 4
distance: 11.00 mi
time: 7:57:07
min/max elev.: 8605’/9087′
elev. gain/loss: 512’/-82′
JMT Day 5
distance: 7.868 mi
time: 8:41:40
min/max elev.: 9067’/11132′
elev. gain/loss: 2162’/-1384′
JMT Day 6
distance: 10.84 mi
time: 8:51:14
min/max elev.: 8954’/10242′
elev. gain/loss: 1469’/-2343′
JMT Day 7
distance: 12.53 mi
time: 7:36:03
min/max elev.: 7476’/9705′
elev. gain/loss: 2001’/-3291′
TOTALS FOR LEG 1
distance: 74.09 mi
time: 59:06:49
min/max elev.: 4002’/11132′
elev. gain/loss: 14085’/-10420′
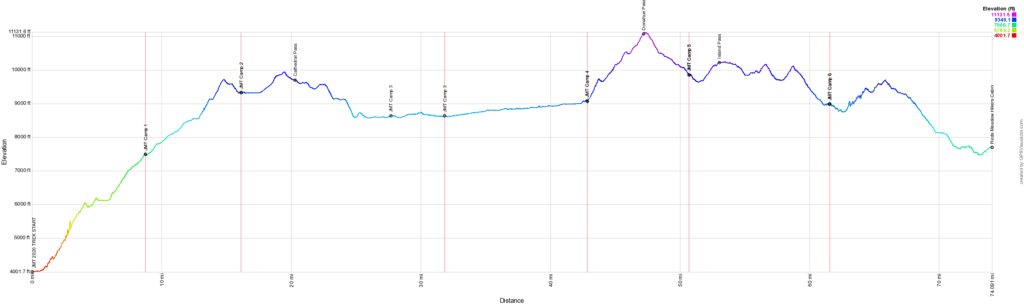
LEG 2 – Reds Meadow to Muir Trail Ranch
(approximate mileage, elevation data, and times)
TRACK STATISTICS
JMT Day 8
distance: 10.10 mi
time: 6:31:53
min/max elev.: 7647’/9994′
elev. gain/loss: 2559’/-330′
JMT Day 9
distance: 11.82 mi
time: 8:34:38
min/max elev.: 9493’/10553′
elev. gain/loss: 1754’/-2178′
JMT Day 10
distance: 12.35 mi
time: 8:55:43
min/max elev.: 7967’/10939′
elev. gain/loss: 2259’/-3785′
JMT Day 11
distance: 12.11 mi
time: 8:25:19
min/max elev.: 7854’/9966′
elev. gain/loss: 3139’/-1536′
JMT Day 12
distance: 13.19 mi
time: 9:16:23
min/max elev.: 7777’/10932′
elev. gain/loss: 1540’/-3331′
JMT Day 13
distance: 4.049 mi
time: 3:41:01
min/max elev.: 7676’/7916′
elev. gain/loss: 485’/-482′
TOTALS FOR LEG 2
distance: 63.62 mi
time: 45:24:57
min/max elev.: 7647’/10939′
elev. gain/loss: 11736’/-11642′
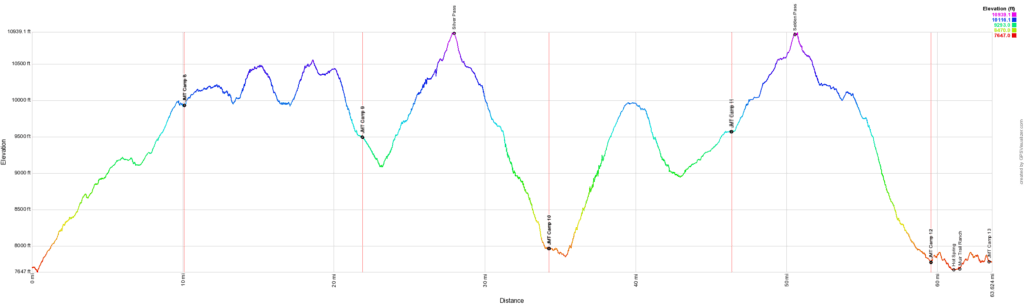
LEG 3 – Muir Trail Ranch to Charlotte Lake
(approximate mileage, elevation data, and times)
TRACK STATISTICS
JMT Day 14
distance: 14.22 mi
time: 8:47:07
min/max elev.: 7771’/9659′
elev. gain/loss: 2395’/-533′
JMT Day 15
distance: 9.618 mi
time: 7:20:55
min/max elev.: 9646’/11463′
elev. gain/loss: 2080’/-275′
JMT Day 16
distance: 11.78 mi
time: 9:15:27
min/max elev.: 8324’/11981′
elev. gain/loss: 690’/-3817′
JMT Day 17
distance: 11.19 mi
time: 7:42:03
min/max elev.: 8036’/10628′
elev. gain/loss: 3038’/-738′
JMT Day 18
distance: 11.02 mi
time: 9:27:02
min/max elev.: 10047’/12099′
elev. gain/loss: 2341’/-2106′
JMT Day 19
distance: 11.26 mi
time: 8:59:57
min/max elev.: 8545’/12156′
elev. gain/loss: 1448’/-3757′
JMT Day 20
distance: 13.66 mi
time: 11:58:33
min/max elev.: 8555’/11988′
elev. gain/loss: 3746’/-1867′
TOTALS FOR LEG 3
distance: 82.75 mi
time: 63:31:04
min/max elev.: 7771’/12156′
elev. gain/loss: 15739’/-13093′
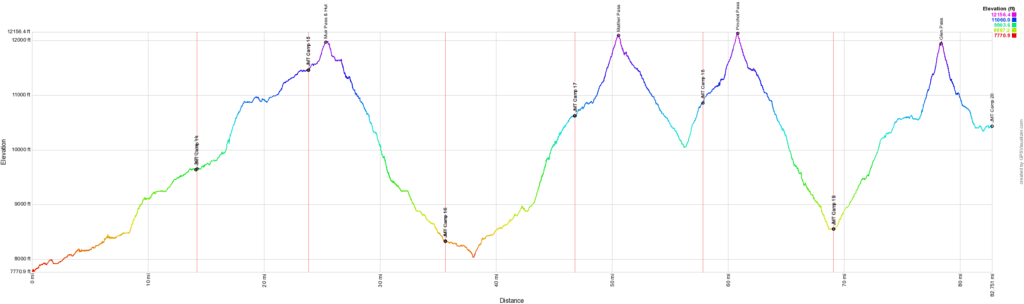
LEG 4 – Charlotte Lake to Mt Whitney and Portal
(approximate mileage, elevation data, and times)
TRACK STATISTICS
JMT Day 21
distance: 7.079 mi
time: 5:44:12
min/max elev.: 9523’/10760′
elev. gain/loss: 1529’/-1437′
JMT Day 22
distance: 10.82 mi
time: 8:57:02
min/max elev.: 10524’/13135′
elev. gain/loss: 2949’/-2425′
JMT Day 23
distance: 11.09 mi
time: 7:41:43
min/max elev.: 10395’/11598′
elev. gain/loss: 2179’/-1718′
JMT Day 24
distance: 9.447 mi
time: 9:22:09
min/max elev.: 11485’/14476′
elev. gain/loss: 3697’/-3191′
JMT Day 25
distance: 7.625 mi
time: 4:41:37
min/max elev.: 8318’/12013′
elev. gain/loss: 355’/-4032′
TOTALS FOR LEG 4
distance: 46.07 mi
time: 36:26:43
min/max elev.: 8318’/14476′
elev. gain/loss: 10711’/-12803′
GRAND TOTALS
(approximate mileage, time on trail (including breaks on trail), and elevation gain/loss)
distance: 266.53 mi
time on trail: 204:30:00
total elevation gain: 52,271 feet
total elevation loss: -47,958 feet
Whew….
266 miles seems a bit higher than I expected. The JMT is 211 miles by itself and getting down to the Portal from the summit is 11 miles.
So 44 miles beyond that. Some of it may be inaccurate GPX tracks and statistics, but I did add some miles around Muir Trial Ranch during my zero day, some short explorations to find campsites, and a few short side trips to see the view and lakes. So, I can believe it was at least 30-35 miles above the official 222 miles. Even if my mind thinks the 266 miles seems it a little bit high, my legs and feet agree with that high number. 🙂
Elevation gain on the JMT (southbound from Yosemite or Mt Whitney Summit) is usually listed as 46,000 to 47,000 feet. So my GPX calculated elevation gain of 52,271 feet isn’t drastically different. Either way, it was a lot of climbing and descending. And either going up or down, it was hard.
Leg 1 was pretty much what I expected: A long climb up from the valley and then a lot of smaller climbs and descents.
Leg 2 was a little annoying to climb back up from Reds Meadow and then doing it all again after Silver Pass. My body was probably still trying to figure out what and why I was doing this to it. 🙂
Leg 3… I knew it would be the hardest leg with two very big climbs followed by big descents. The smaller dip between Mather and Pinchot Passes helped me survive long enough to make it over Glen Pass.
Leg 4… wasn’t that big of a deal at that point. The first time I climbed Forester Pass I remembered it being worse than it was this time, but the first time it was on Day 2 of my trek and this time it was day 21. So, I was probably not fully acclimatized yet and the snow fields I had to detour around on that first time over Forester Pass probably left me with a memory of the hard climb that was exaggerated.
And the climb to Mt Whitney’s summit, while hard, was also pretty straight forward. I was more worried about the weather, the timing of my attempt, and if I should try to stay overnight at the summit than I was about actually reaching the summit. I guess being the third time took some of the concern away.
They say on long thru hikes your body gets used to the repeated punishing daily hikes. I can now believe that through my personal experience.
After reviewing all the data, I hiked more than 10 miles on 17 days out of the 25 days. Considering I usually try to keep my backpacking hikes under 10 miles each day and I usually did closer to 6-7 miles most of the time, I was very pleasantly surprised at how many days I managed to exceed that. I had hoped to do the whole trek in 22 days, but knew it may take me longer. Mostly, I thought that I wouldn’t be able to hike as far each day as the itinerary indicated.
But the 3 extra days I took on the trail was more due to rain/storm delays, a longer time spent relaxing around MTR than I expected when I started, and stopping a little earlier on few days. Actual distance covered on most days was more than enough.

Comments by WanderingJim
PCT DAY 85 – CA Section H
"No cell service in many parts of the PCT. Not dead yet."
PCT or BUST!
"Yes, I’ll be going through there by early August"
JMT 2020 Day 3
"I'm afraid I have no idea. Not really a fisherman, so don't..."
JMT 2020 Trek Day by Day
"Yeah, but with 9,000 pictures, it's hard to label each one..."
Kilimanjaro – October 2019
"Everest Base camp is on my list too. Mostly since I know..."